
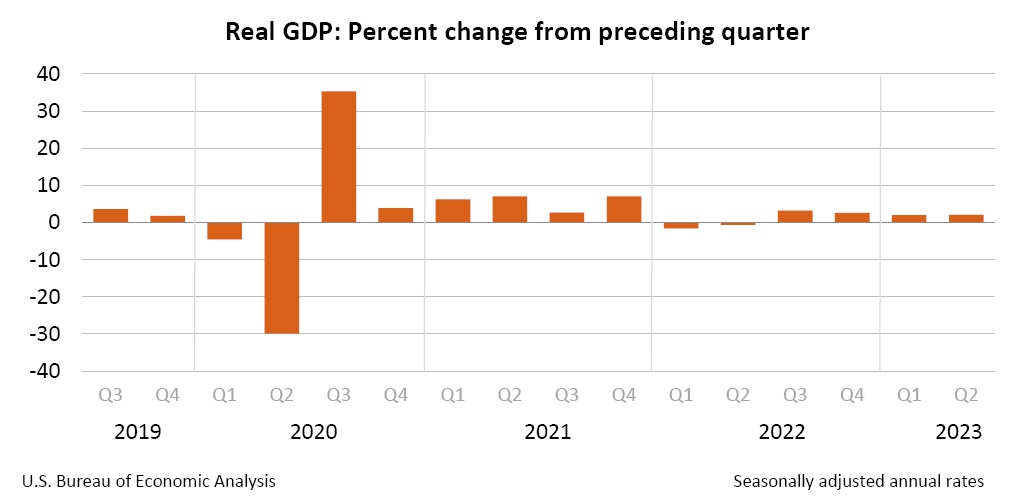
U.S. real gross domestic product (GDP) increased at an annual rate of 2.1% in the Q2 2023, according to the "second" estimate released by the Bureau of Economic Analysis. In the Q1, real GDP increased 2%.
The GDP estimate released today is based on more complete source data than were available for the "advance" estimate issued last month. In the advance estimate, the increase in real GDP was 2.4%.
The increase in real GDP reflected increases in consumer spending, nonresidential fixed investment, state and local government spending, and federal government spending that were partly offset by decreases in exports, residential fixed investment, and private inventory investment. Imports, which are a subtraction in the calculation of GDP, decreased.
Compared to the Q1, the acceleration in real GDP in the Q2 primarily reflected a smaller decrease in private inventory investment and an acceleration in nonresidential fixed investment. These movements were partly offset by a downturn in exports, and decelerations in consumer spending and federal government spending. Imports turned down.
Current‑dollar GDP increased 4.1% at an annual rate, or $268.6 billion, in the Q2 to a level of $26.80 trillion, a downward revision of $36.3 billion from the previous estimate.
The price index for gross domestic purchases increased 1.7% in the Q2, a downward revision of 0.2 percentage point from the previous estimate. The PCE price index increased 2.5%, a downward revision of 0.1 percentage point. Excluding food and energy prices, the PCE price index increased 3.7%, a downward revision of 0.1 percentage point.
Personal Income
Current-dollar personal income increased $232.1 billion in the Q2, a downward revision of $3.9 billion from the previous estimate. The increase primarily reflected increases in compensation (led by private wages and salaries), personal income receipts on assets (both personal interest income and personal dividend income), personal current transfer receipts (led by government social benefits), and rental income of persons.
Disposable personal income increased $284.5 billion, or 5.9%, in the Q2, an upward revision of $36.3 billion from the previous estimate. Real disposable personal income increased 3.3%, an upward revision of 0.8 percentage point.
Personal saving was $892.3 billion in the Q2, an upward revision of $22.7 billion from the previous estimate. The personal saving rate – personal saving as a percentage of disposable personal income – was 4.5% in the Q2, an upward revision of 0.1 percentage point.
Gross Domestic Income and Corporate Profits
Real gross domestic income (GDI) increased 0.5% in the Q2, in contrast to a decrease of 1.8% in the Q1. The average of real GDP and real GDI, a supplemental measure of U.S. economic activity that equally weights GDP and GDI, increased 1.3% in the Q2, compared with an increase of 0.1% in the Q1.
Profits from current production (corporate profits with inventory valuation and capital consumption adjustments) decreased $10.6 billion in the Q2, compared with a decrease of $121.5 billion in the Q1.
Profits of domestic financial corporations decreased $47.8 billion in the Q2, compared with a decrease of $9.4 billion in the Q1. Profits of domestic nonfinancial corporations increased $17.1 billion in the Q2, in contrast to a decrease of $102.9 billion in the Q1. Rest-of-the-world profits increased $20.2 billion in the Q2, in contrast to a decrease of $9.2 billion in the Q1. In the Q2, receipts increased $18.2 billion and payments decreased $2.0 billion.