The population of the State of Texas grew by 470,708 persons between 2021 and 2022, according the Census Bureaus’ latest estimates. This nominal increase was the largest of any state. Texas joined California as the second state to have a total population above 30 million, with a total estimated population of 30,029,572 on July 1, 2022. This population growth has supported strong growth for home building, as National Association of Home Builders (NAHB) reports.
Within Texas, the Census designates 25 Metropolitan Statistical Areas. Four MSAs had a population above 2 million in 2021 (most recent available data at the MSA level). The Dallas-Fort Worth-Arlington and Houston-The Woodlands-Sugar Land are the 4th and 5th largest MSAs in the US.
Single-family permitting within Texas follows a similar ranking as population, with the exception of College Station-Bryan and Lubbock both joining the top ten. While the San Antonio-New Braunfels has approximately 250,000 more in population than Austin-Round Rock, Austin-Round Rock authorized 11,229 more permits than San Antonio-New Braunfels in 2021.
Single-family permits per capita is a statistic that NAHB can use to compare the different MSAs of Texas. With the total number of single-family permits, NAHB is unable to compare MSAs on an equal level because areas with higher populations almost always have more single-family permits.
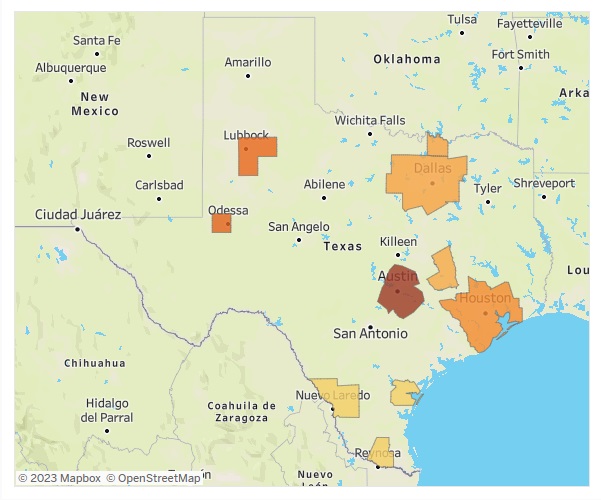
The ten highest permits per capita per MSA in 2021 are all displayed in the map above along with their 2021 total single-family permits and population estimates.
Three of the four largest MSAs in Texas had the ten highest permits per capita. Austin-Round Rocks’ ratio was 0.011 permits per capita, the highest of any MSAs in Texas. This is approximately 1 permit for every 93.4 persons in Austin-Round Rock. The ratio is 0.002 higher than the next highest ratio of permits per capita, which is 0.009 in Odessa.
All of the ten MSAs have a positive median growth rate, consistent with broad state population growth. The last time the state posted a yearly population decline was in 1949(-0.04%). Austin-Round Rock had the highest median growth rate of the MSAs at 3.15% over the 41-year period, and is the only MSA of the ten with a median above 3.00%. Dallas-Fort Worth-Arlington median growth rate was 2.20%, slightly higher than Houston-The Woodlands-Sugar Land at 2.09%. Lubbock, Corpus Christi, and Odessa had median growth rates below 1.00%.
Total single-family permits in Texas for the ten MSAs is again similar to their population rankings. The Houston-The Woodlands-Sugar Land has permitted consistently on a higher basis than Dallas-Fort Worth-Arlington since 2005, despite both MSAs having similar population growth over the past 40 years. In 2021, the gap between the two MSAs shrunk to 516 permits.
Dallas-Fort Worth-Arlington and Houston-The Woodlands-Sugar Land have authorized the most permits due to being significantly larger than other MSAs in Texas. They both reached a prior peak in 2005-2006 during the pre-Great Recession housing boom. Dallas-Fort Worth-Arlington did surpass this peak in 2021 while Houston-The Woodlands-Sugar Land is just short of these pre-Great Recession levels. Austin-Round Rock, the MSA with the highest population growth rate, passed their 2005-2006 peak in 2018.